欢迎来到桔子雨工作室官方网站!桔子雨工作室是一个软件和信息技术服务提供商,为中小微企业提供数字化价值。
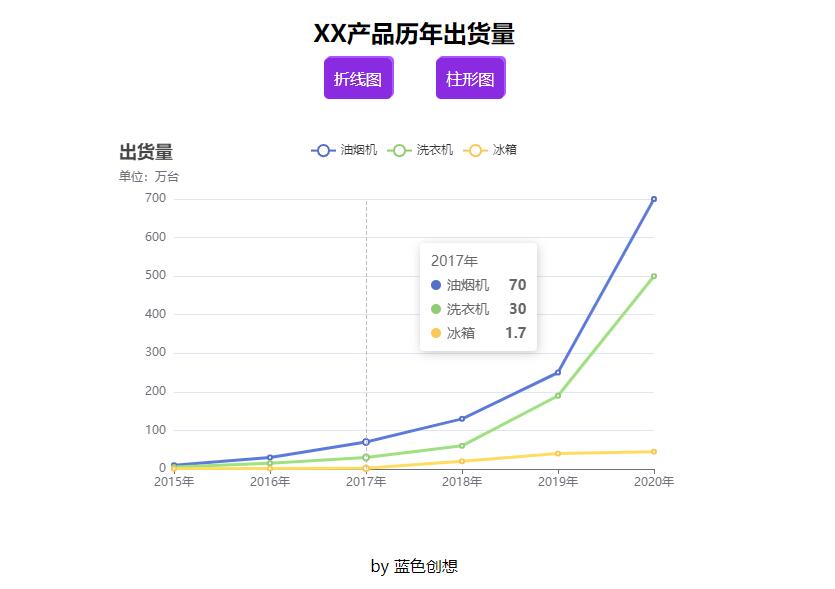
利用echats做数据可视化图表

完整代码如下
<!DOCTYPE html>
<html>
	<head>
		<meta charset="utf-8">
		<meta name="viewport" content="width=device-width, initial-scale=1.0, user-scalable=0, minimum-scale=1.0, maximum-scale=1.0">

		<title>折线图</title>
		<!-- 引入 ECharts  -->
		<script src="https://cdn.jsdelivr.net/npm/echarts@5.0.1/dist/echarts.min.js"></script>
		<style type="text/css">
			#main {
				max-width: 600px;
				width: 100%;
				height: 400px;
				margin: 0 auto;
				margin-top: 50px;
			}

			.btn,
			p {
				text-align: center;
			}

			.btn>a {
				margin: 20px;
				padding: 10px;
				background-color: blueviolet;
				color: #fff;
				text-decoration: none;
				box-shadow: #aa55ff 2px -2px;
				border-radius: 5px;
			}
		</style>
	</head>
	<body>
		<div class="btn">
			<h2>XX产品历年出货量</h2>
			<a href="index.html">折线图</a>
			<a href="index2.html">柱形图</a>
		</div>
		<div id="main">
		</div>
		<p>
			by 蓝色创想
		</p>
		<script type="text/javascript">
			// 基于准备好的dom,初始化echarts实例
			var myChart = echarts.init(document.getElementById('main'));
			//指定图标的配置项和数据
			var option = {
				title: {
					text: '出货量',
					subtext: '单位:万台'
				},//鼠标滑过时候显示对应数据
				tooltip: {
					trigger: 'axis'
				},
				legend: {
					data: ['油烟机', '洗衣机', '冰箱']
				},//显示下载按钮,将图表为保存为png图片
				toolbox: {
					featrue: {
						saveAsImage: {}
					}
				},
				xAxis: {
					type: 'category',
					boundaryGap: false,
					data: ['2015年', '2016年', '2017年', '2018年', '2019年', '2020年']
				},
				yAxis: {
					type: 'value'
				},
				series: [{
					name: '油烟机',
					type: 'line',
					data: [10, 30, 70, 130, 250, 700]
				}, {
					name: '洗衣机',
					type: 'line',
					data: [5, 15, 30, 60, 190, 500]
				}, {
					name: '冰箱',
					type: 'line',
					data: [0.5, 1, 1.7, 20, 40, 45]
				}]
			};
			//使用刚才指定的配置项和数据显示图标
			myChart.setOption(option);
		</script>
	</body>
</html>
记录几点重点
- series中的type值:line(折线图),bar(柱形图)。
- tooltip中trigger: ‘axis’鼠标滑过时显示提示数据。
微信扫描下方的二维码阅读本文


